Macro Monthly and Price Model Reports
We are happy to announce the addition of two new reports to our silver and gold plans:
The Macro Monthly – a monthly deep dive into the economy and currency of every nation that moves the global prices of the target commodity, explaining what happened, how that affected the target commodity’s price, and what we expect to happen.
The Price Model Report – a monthly report with our model's price forecast for coffee, cocoa, sugar and cotton, ranging from one week to eighteen months ahead.
In this article, we will dive into each of the new reports, explaining their contents, how to read them, and in what ways this information can be useful to everyone who operates in cocoa markets.
Part 1 – The Macro Monthly
Why currencies matter in the softs
Every soft commodity has a selling side and a buying side. Most of the time, they will not share a common currency, meaning that exchange rates will directly affect how the relationship between the two parties plays out.
On the selling side are the producing nations. When the currency of a producing country weakens, its farmers receive more local money for each dollar of product, so selling picks up and pressure on the price grows. When it strengthens, the opposite happens and origin selling slows.
On the buying side are the importers and processors. A Chinese or Indian cotton mill pays for its bales in dollars but earns in yuan or rupees. When its currency weakens, imported cotton becomes more expensive and buying slows.
Above both sides sits the US dollar. A stronger dollar makes the commodity dearer for everyone who does not earn in dollars.
Each Macro Monthly follows the currencies that matter for its commodity:
Report | Currencies covered |
Cocoa Macro Monthly | CFA franc, Nigerian naira, Ghana cedi, Indonesian rupiah, Malaysian ringgit, British pound, US dollar |
Cotton Macro Monthly | Brazilian real, Chinese yuan, Indian rupee, US dollar |
Coffee Macro Monthly | Brazilian real, Vietnamese dong, Colombian peso, euro, Japanese yen, US dollar |
How to use the Macro Monthly Report
Traders get the calendar of the month's risk events with a view on each: in the October cotton edition, Brazil's runoff on 25 October and the Federal Reserve's decision on 28 October.
Hedge funds and analysts can use the Impact Index to separate the currency component of a price move from the fundamental one, and the weights to size macro exposure across a softs book.
Banks and trade finance teams can follow the currencies that decide how fast origins sell and how much importers can afford, which affects the flows they finance.
Exporters, cooperatives, mills and roasters can time their hedges and local-currency budgets with an explicit expected level and range, instead of a general feeling about the dollar.
[Stay ahead of the macro factors moving soft commodity markets. Get access to our Macro Monthly with a Silver or Gold subscription.]
The Whole Month at a Glance
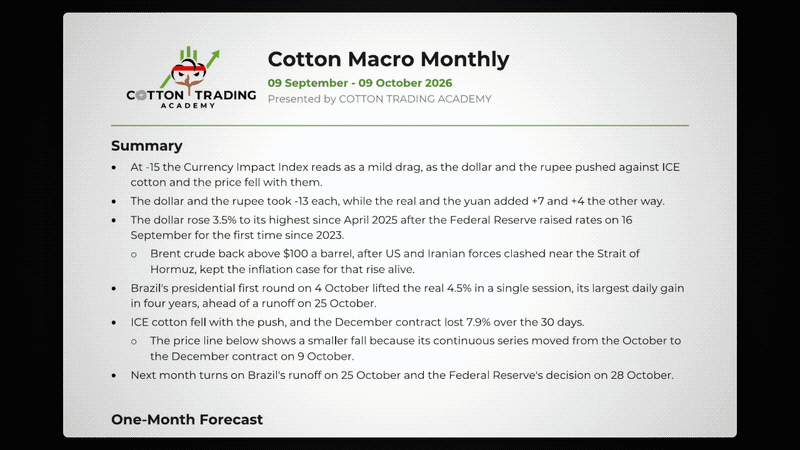
Good FX reports often start with a summary, so that a reader who has two minutes can finish the front page knowing what the currencies did to the price this month and what to watch for next month.
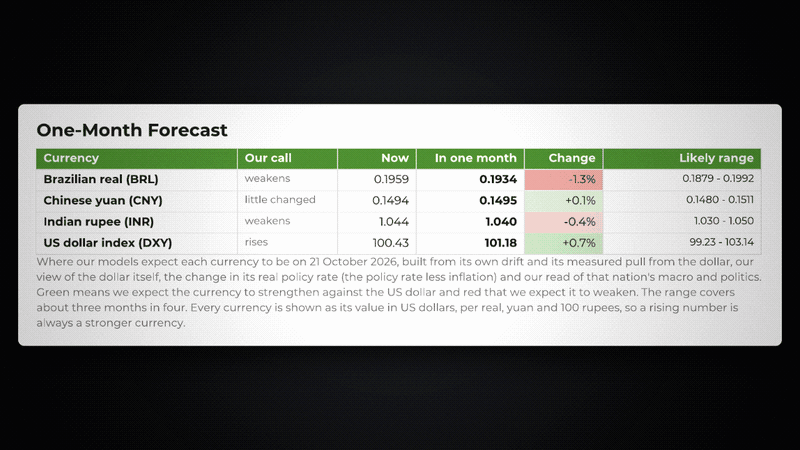
In our reports, we follow the summary with a first view of the forecasts. For every currency, we publish where we expect it to be one month in the future, along with a likely range and what the expected change means in percentage terms.
All the values, both in the table and throughout the report, are in USD, making the comparison easier and simpler. A rising number is always a stronger currency, so you never have to remember which way a pair is quoted.
The range, in turn, shows where the currency is most likely to be. Unlike an exact projection, the range is calculated based on the currency's volatility to capture three months in every four, meaning there is a 75% chance that the value will be inside it one month in the future.
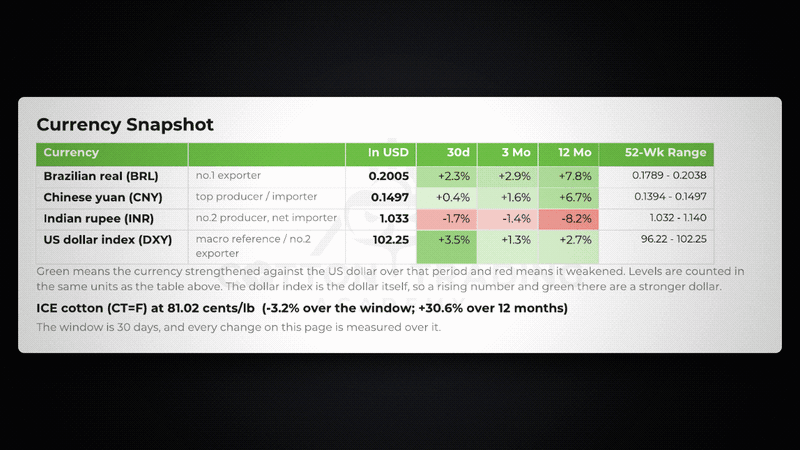
Below the forecasts table, the Currency Snapshot shows how each currency has moved over 30 days, three months and twelve months, and where it sits within its 52-week range. Green means the currency strengthened against the dollar and red means it weakened.
Although forecasts and projections are usually the main reason why most people pay for reports, understanding the past might be as important as knowing the future. After all, the models are not created out of thin air but instead come from all the data and insight analysts and experts collect over the years.
The Index
When talking about the past, though, the first question that comes to everyone's mind is: how did the currencies impact prices?
The Currency Impact Index answers it with one number on a scale from −100 (a strong drag on the price) to +100 (strong support). Each currency receives a weight according to its importance in that market, which is calculated based on our estimates of the impact of that currency on the global price. We multiply each currency's move by its weight and by the direction in which it affects the price, and the index shows each currency's contribution separately.
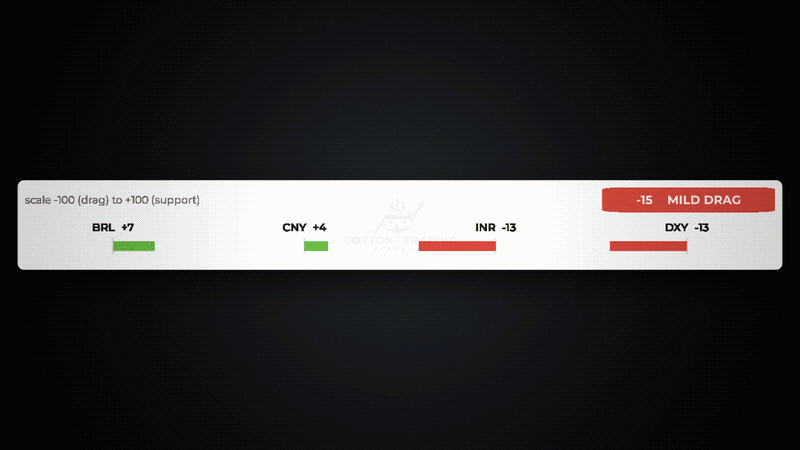
In the October edition, the index read −15, a mild drag. The dollar rose 3.5% after the Federal Reserve's first rate rise since 2023, and the rupee fell to within about 0.1% of its record low. Each took 13 points from the index. The real and the yuan pushed the other way, with +7 and +4. ICE cotton's December contract lost 7.9% over the same 30 days.
[Understand the forces behind cocoa price movements. Our Macro Monthly breaks down the currencies and economic developments that matter. Subscribe to Silver or Gold.]
Of course, we do not claim that currencies explain every move. Instead, the index separates the currency effect from everything else, so the reader can see how much of a price move came from macro and how much must come from supply and demand.
Country Sections
After the front page, the report takes one section per currency, grouped into the selling side, the buying side and the reference rates. Every section follows the same order:
Forecast: Next Month – where we expect the currency to be and the events that could change it (central bank meetings, elections, inflation releases, etc.).
A seven-month chart – six months of history plus the projected month.
What happened – the month's macro and political events in that country.
How the currency moved – which of those events actually moved the currency, and which did not.
What it did to the commodity – how the move reached the price.
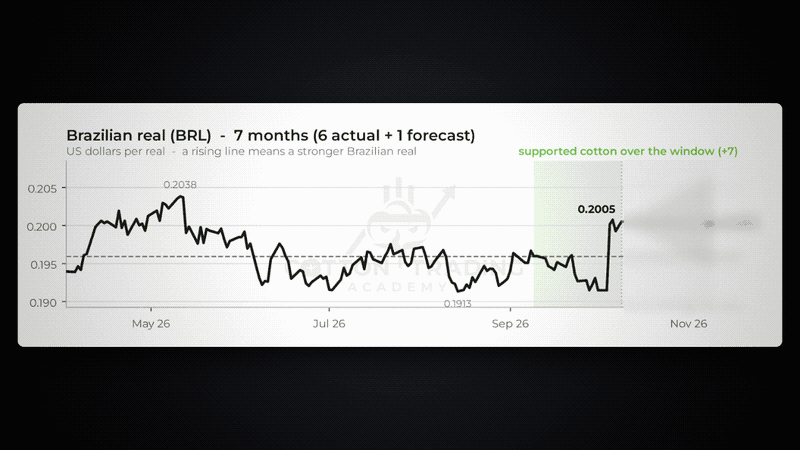
The real's section in October is a good example. The central bank had cut interest rates, a dispute in the Supreme Court had raised institutional risk and the dollar was climbing: three reasons for a weaker real, and it did weaken until the vote. Then the first round of the presidential election outweighed all three in one session. The section closes with what that means for cotton: holding the gain would keep Brazilian selling slow, while a reversal after the runoff would bring Brazilian cotton forward.
How the forecast is built
Each one-month projection combines:
The currency's own trend and its measured pull from the dollar. Over the past five years, for example, the yuan has followed about 44% of each move in the dollar.
Our view of the dollar itself.
The change in the real policy rate – the interest rate minus inflation – which drives the carry that holds a currency up.
Money growth, which we read with a lag. Above all else, inflation is a monetary phenomenon, so the growth of a nation's money stock months earlier tells us more than the latest consumer-price index.
Our read of that nation's macroeconomy and politics, researched through its own central bank, budget and press, using direct local sources.
Every projection is scored against what actually happened when the next edition is written. The August edition, for example, made some of its projections on the assumption that the Fed would hold interest rates, which did not happen in the end; so, when the September report was published, it commented on that. A forecast you cannot check is not worth much, and that applies to us as well.
[Access our Macro Monthly for currency forecasts, market analysis, and insights into what's ahead.]
Part 2 – The Price Model Report
Commodity forecasts are everywhere in the market. From social media posts to free newsletters, there is no shortage of people telling you how the market will behave. Most of those forecasts, though, will lack the same thing.
An analyst will shout at the top of his lungs that cocoa prices will see a new rally, or that prices will crash into oblivion. Then, a year and a half later, if cocoa does move the way he said, he will claim that he can predict the future. The one thing he will not do, though, is present a timeline. After all, commodity prices go up and down all the time, so no matter the projection, it will eventually be correct if we wait long enough. By not mentioning when something will happen, a forecast can always be right, but it will always be useless.
That is why, in our own reports, we take a different approach. It is not enough to say that prices are "likely to rise". We want to know by how much, by when, with what range and with what probability.
Our new Price Model Report is the embodiment of this idea. It quantifies our full research, combining our supply-and-demand balance sheet with weather, technicals, macroeconomic factors and statistical movements into one forecast path. With each edition, we adjust for everything that has happened over the month, from changes in fundamental expectations to new macro forecasts, and for how the price has been affected during the period.
How to use the Price Model Report
Traders can compare the market price with the model's path and fair value, looking for gaps the market has not priced yet.
Hedge funds can use the ranges and the scenario probabilities to size positions and set stops against an explicit view of volatility.
Banks and risk managers can use the two-standard-deviation range to stress-test collateral and credit lines tied to commodity values.
Producers, exporters and manufacturers can plan purchases, sales and hedge ratios against a defined range of outcomes at the horizon that matters to them, whether that is next month or next season.
The forecast table
The first thing on the page is the forecast table. It covers six horizons, from one week to eighteen months ahead, and presents all the main data points of the report.
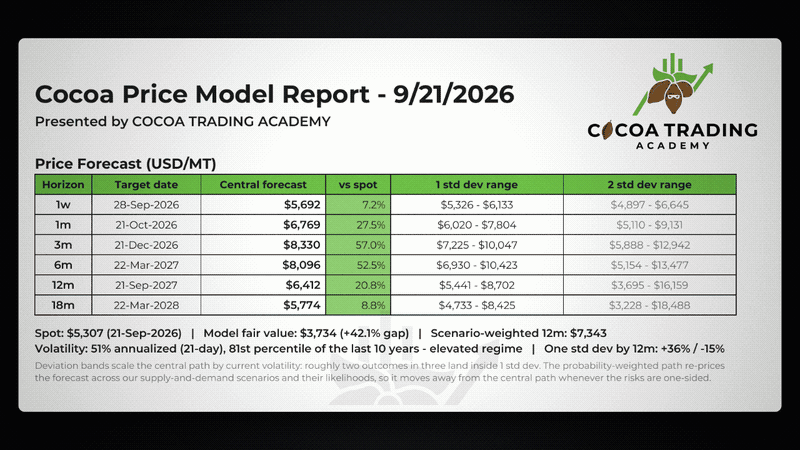
For each horizon you get:
The central forecast and how far it is from today's price.
A one-standard-deviation range, where about two outcomes in three should land.
A two-standard-deviation range for stress-testing: moves that are unlikely but possible.
[Want to know where cocoa prices could be headed? Our Price Model Report provides forecasts from one week to eighteen months ahead. Explore our Silver and Gold plans.]
Under the table, one line gives the context every forecast needs: the spot price, the model's fair value (what our stocks-and-consumption relationship implies for the price), the scenario-weighted twelve-month price and the current volatility, with its percentile over the last ten years. If volatility is in an elevated regime, the ranges widen to match, ensuring all possibilities are accounted for.
The forecast chart
While the table provides the highlights, the chart presents the entire path. It combines the main price model, the less likely bullish and bearish scenarios, and the probability-weighted path.
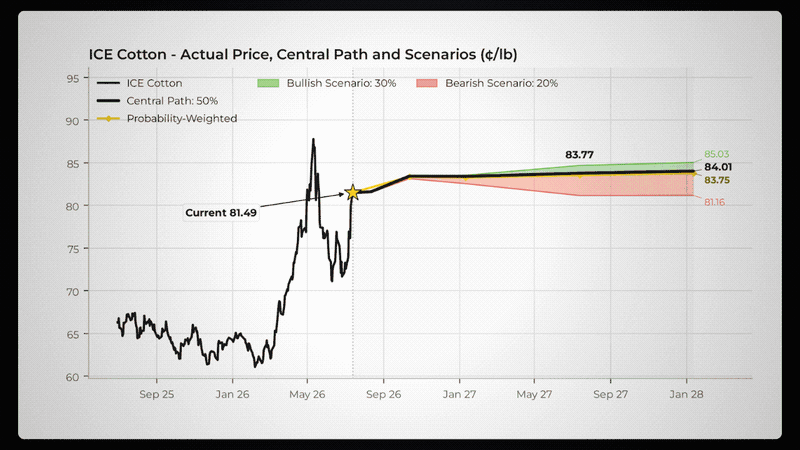
How to read it:
The black line is the actual price over the past year, and the star marks today's price.
The dotted black line is the model's central forecast path.
The gold line is the probability-weighted path. It re-prices the forecast across all our scenarios according to their probabilities. When it moves away from the central path, the risks are one-sided, and the chart shows you which side.
The green and red cones show where the bullish and bearish scenarios take the price at each quarterly horizon. As in the example, a tall green cone and a short red cone mean the risk of an uptrend is higher, while even if the bearish case is confirmed, it will have a smaller impact on the central forecast.
In the real report, the chart also plots the model's past one-month-ahead forecasts against the actual price, so you can judge for yourself how well the model has been tracking the market.
What drives the forecast
A forecast is only useful if you know why it says what it says. The second page breaks the central path down into four pillars, fundamentals, weather, technicals and macro, and shows how much each one adds to or takes from the price at three, twelve and eighteen months.
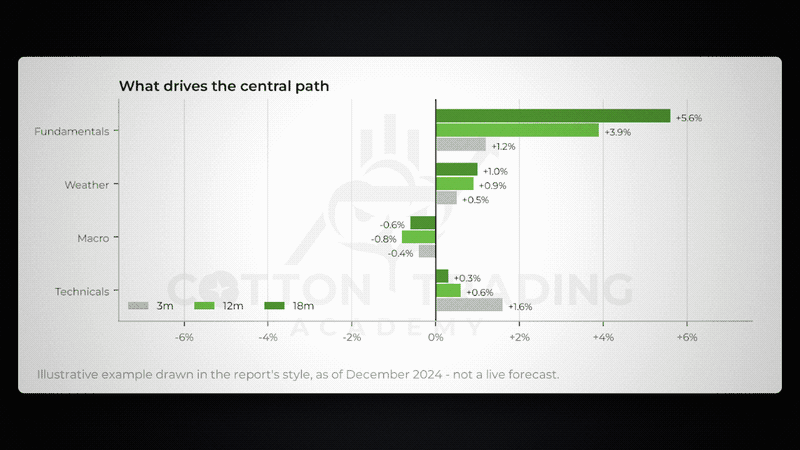
This breakdown allows you to use the information we provide in the most efficient way for your particular case. If the model's weather contribution seems too large, for example, you know exactly which part of the forecast to discount. The macro pillar is fed by the same house view of the currencies that the Macro Monthly publishes, so the two reports work together; the Macro Monthly explains the currencies in detail, and the Price Model Report shows how much they weigh on the price.
[Our Price Model Report combines fundamentals, weather, technicals, and macro factors into a forecast path. Subscribe to Silver or Gold today.]
Scenarios and probabilities
No single model can perfectly capture every possibility, especially in the insanely volatile world of commodities. With this in mind, we not only provide one price path, but instead consider less likely but possible alternatives, where events unfold in a different way than what we expect. The scenario table sets out our base case, a bullish case and a bearish case, the price each one implies at twelve and eighteen months, the probability we give it and what it assumes.

This is particularly interesting when combined with the other reports we provide, especially the weekly ones. By staying up to date with the most important events affecting each commodity and with in-depth analysis, you can judge and decide whether you agree with the base model view. If you find that you do not, there is already a complete forecast for the other possibilities.
In the current cocoa edition, for example, the bullish scenario assumes an even more severe El Niño, that cuts West African crops on the scale of 2023/24 or even more, while the bearish scenario considers the expected damage might be overstated, keeping supply strong.
free trial here
This is the same impact-and-probability thinking that sits behind our Coffee Value Score, the size of a possible move multiplied by the chance that it happens. The probability-weighted line on the chart is the result.
Each report closes with a short Model Read in plain language – what the model expects, what is driving it and what changed since the previous edition – and the dates of the market, weather and ENSO data on which it was built.
[Our Silver or Gold plans include the Macro Monthly and The Price Model Report. Free trial the plans here! ]


Comments